
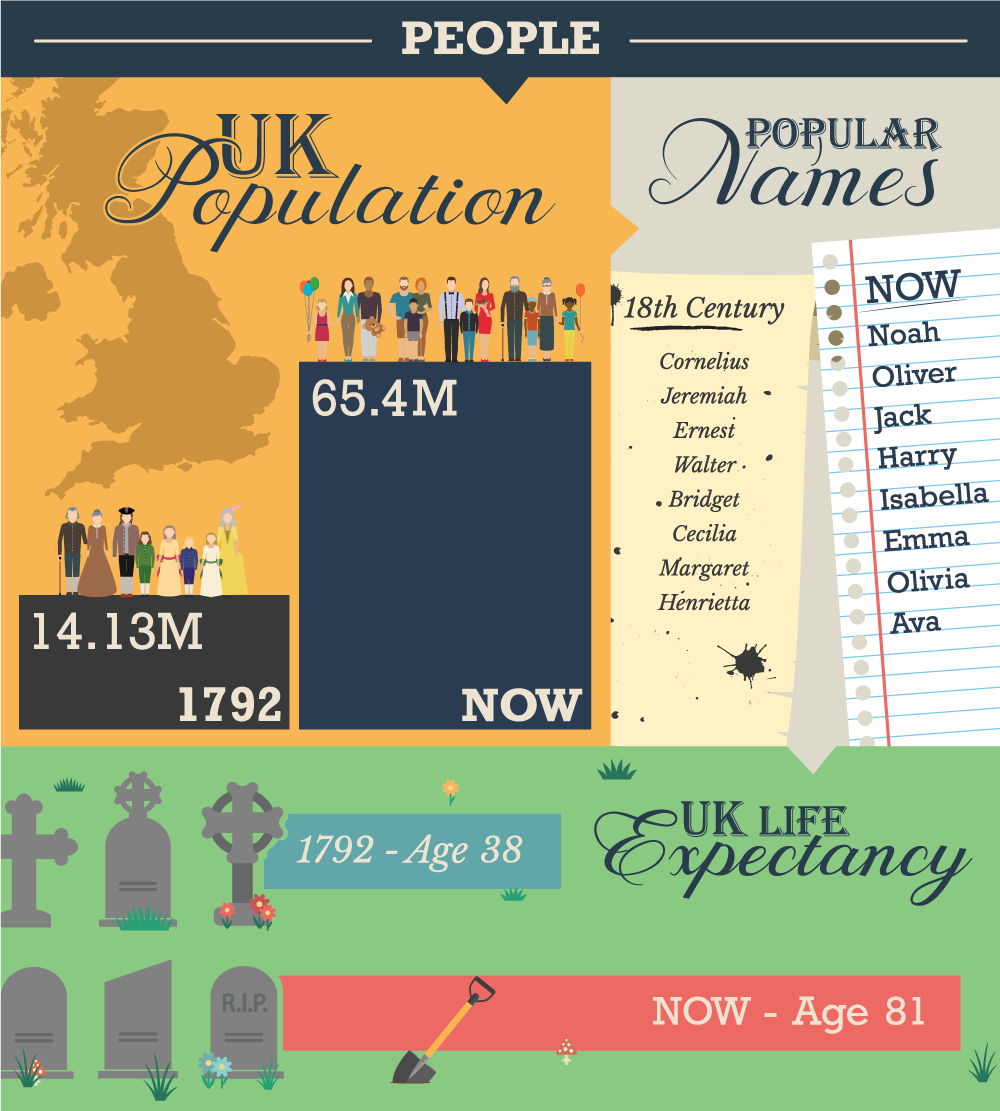
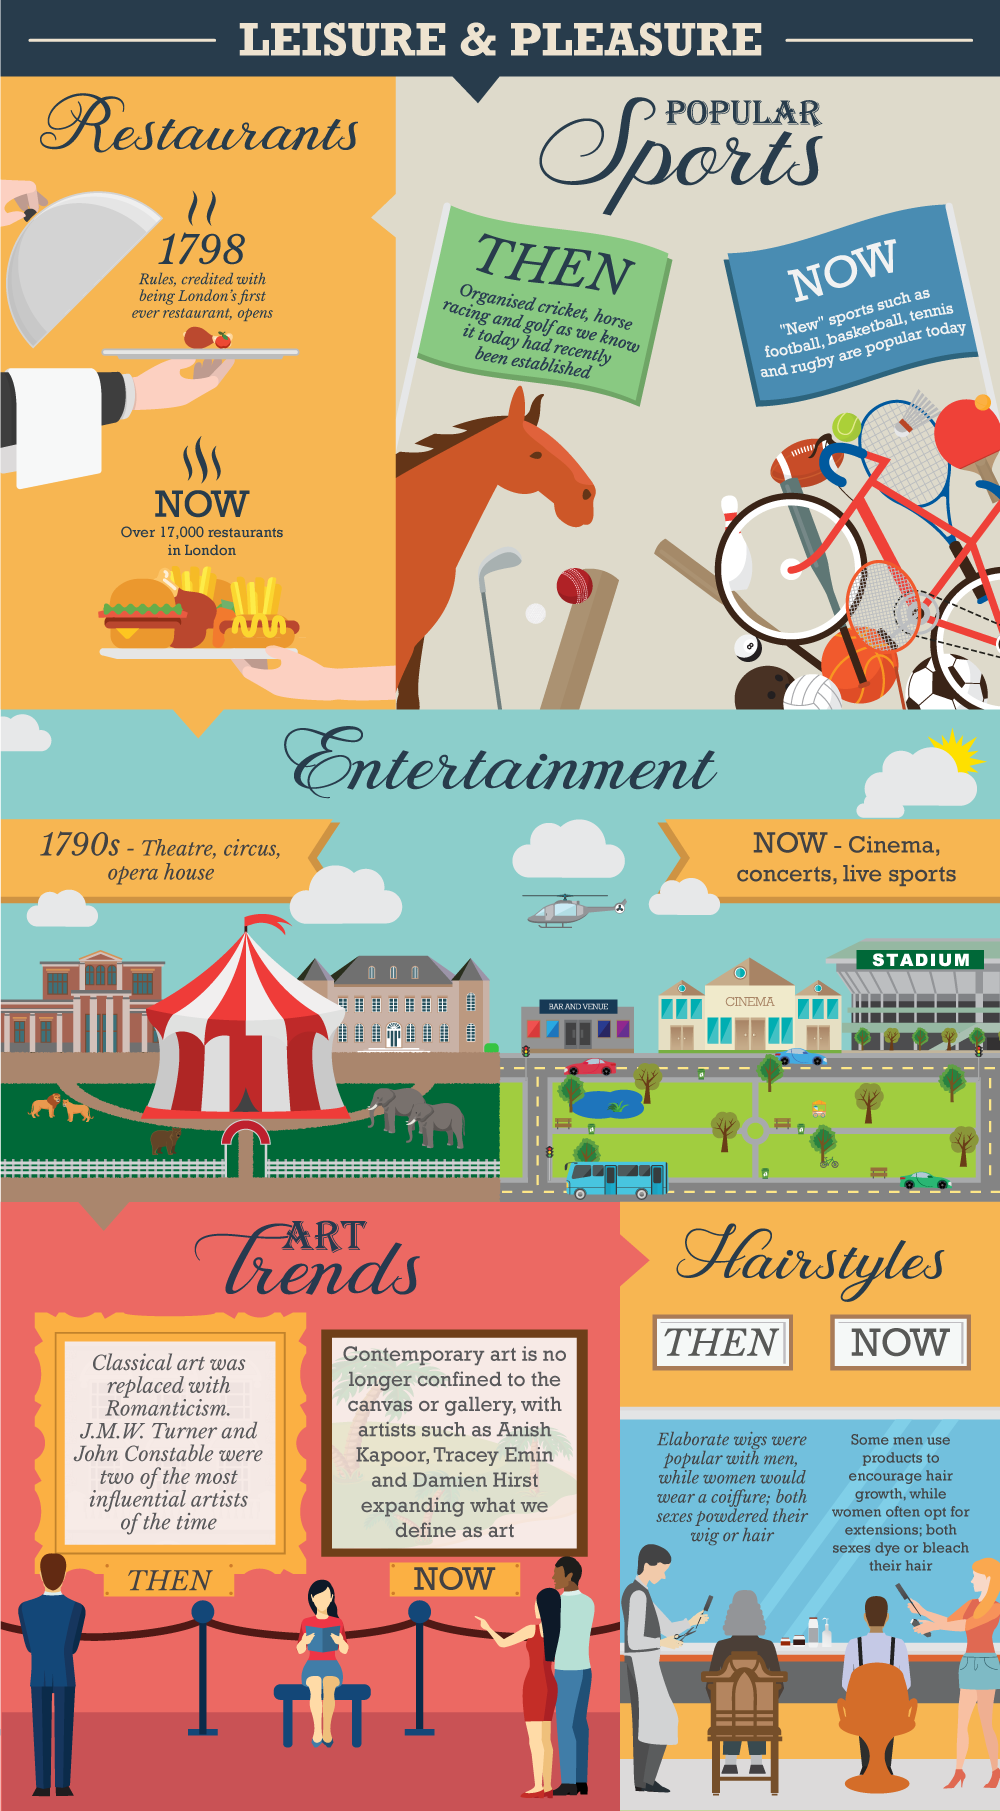
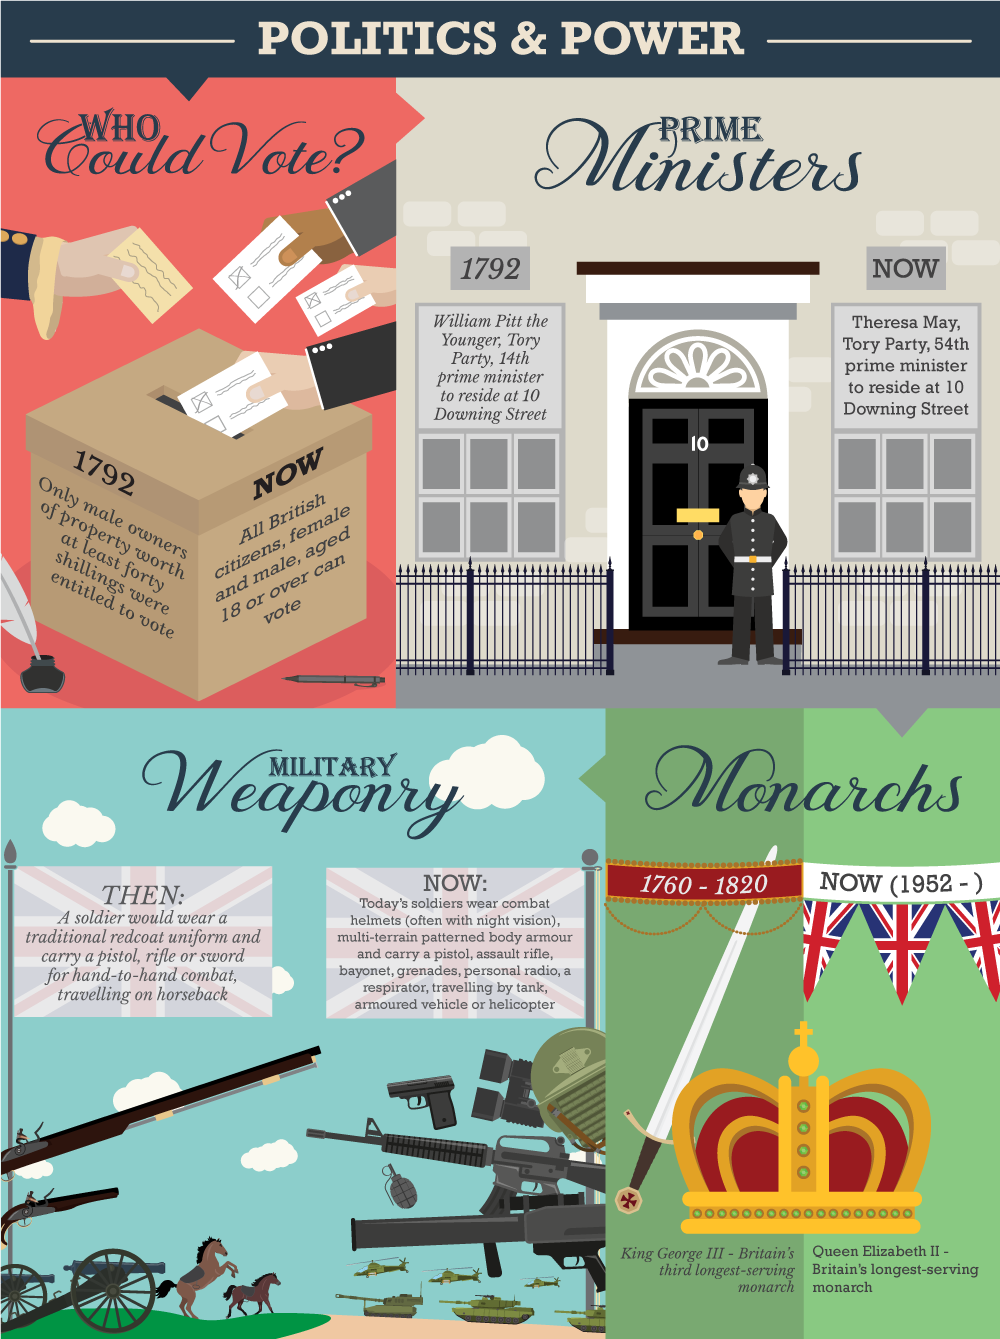
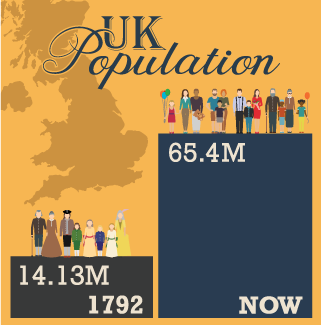
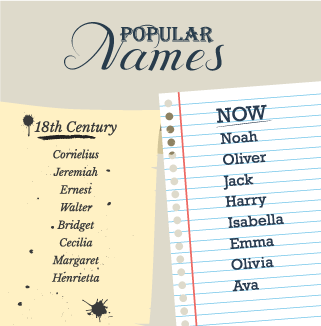
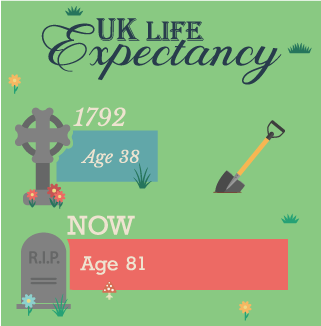
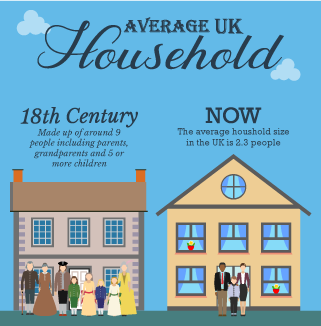
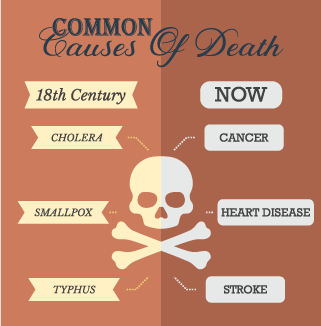
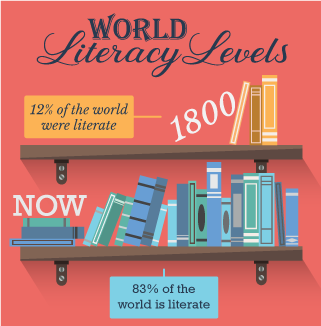
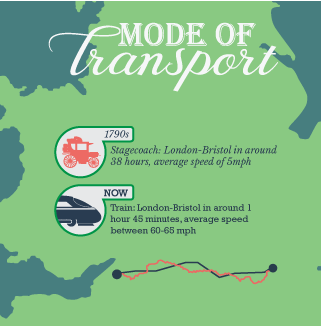
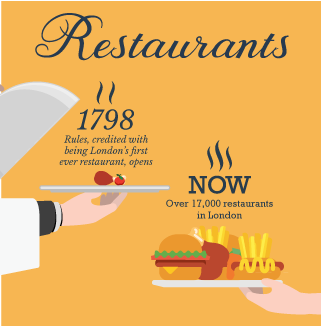
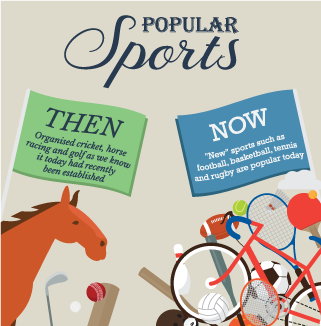
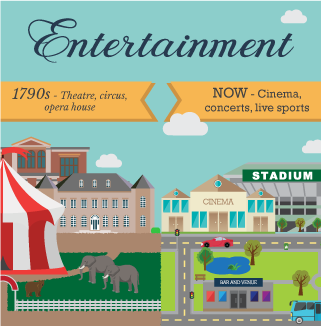
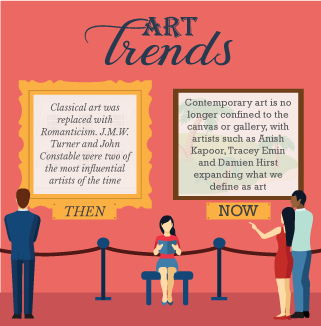
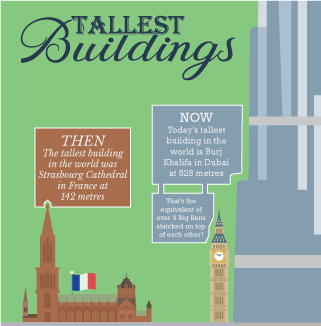
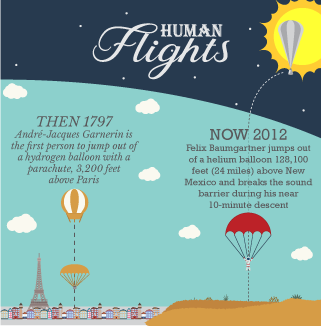
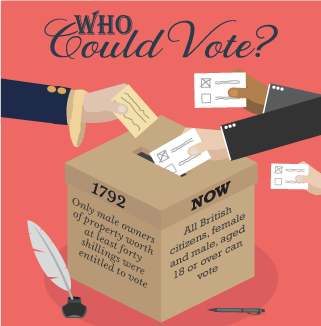
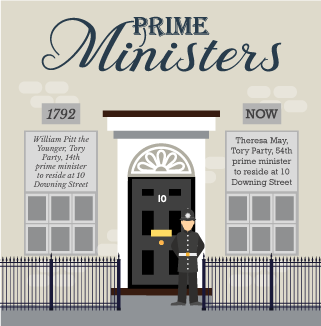
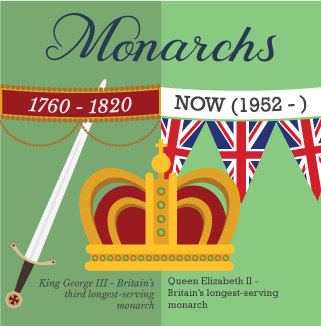
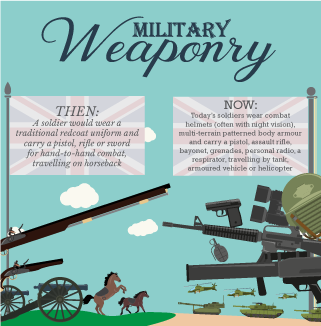
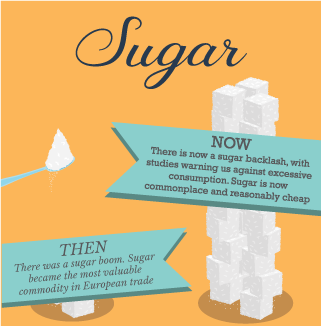
The first big project I got to lead the design on when I joined M2 Bespoke was this info-graphic for WHSmith. To celebrate 225 years of WHSmith, we came up with the idea of a comparison info-graphic where we compared statistics from 1792 (the year WHSmith was founded) to 2017 (the year we created this piece). I loved every moment of this project, not just because of the excitement of designing for a big client, but because of the insight into the past and the use of the playful style of design we adopted. The original piece was designed as a continuous horizontal graphic but as you can see below, I've split the graphic up into the categories we featured through-out for the ease of the viewer.


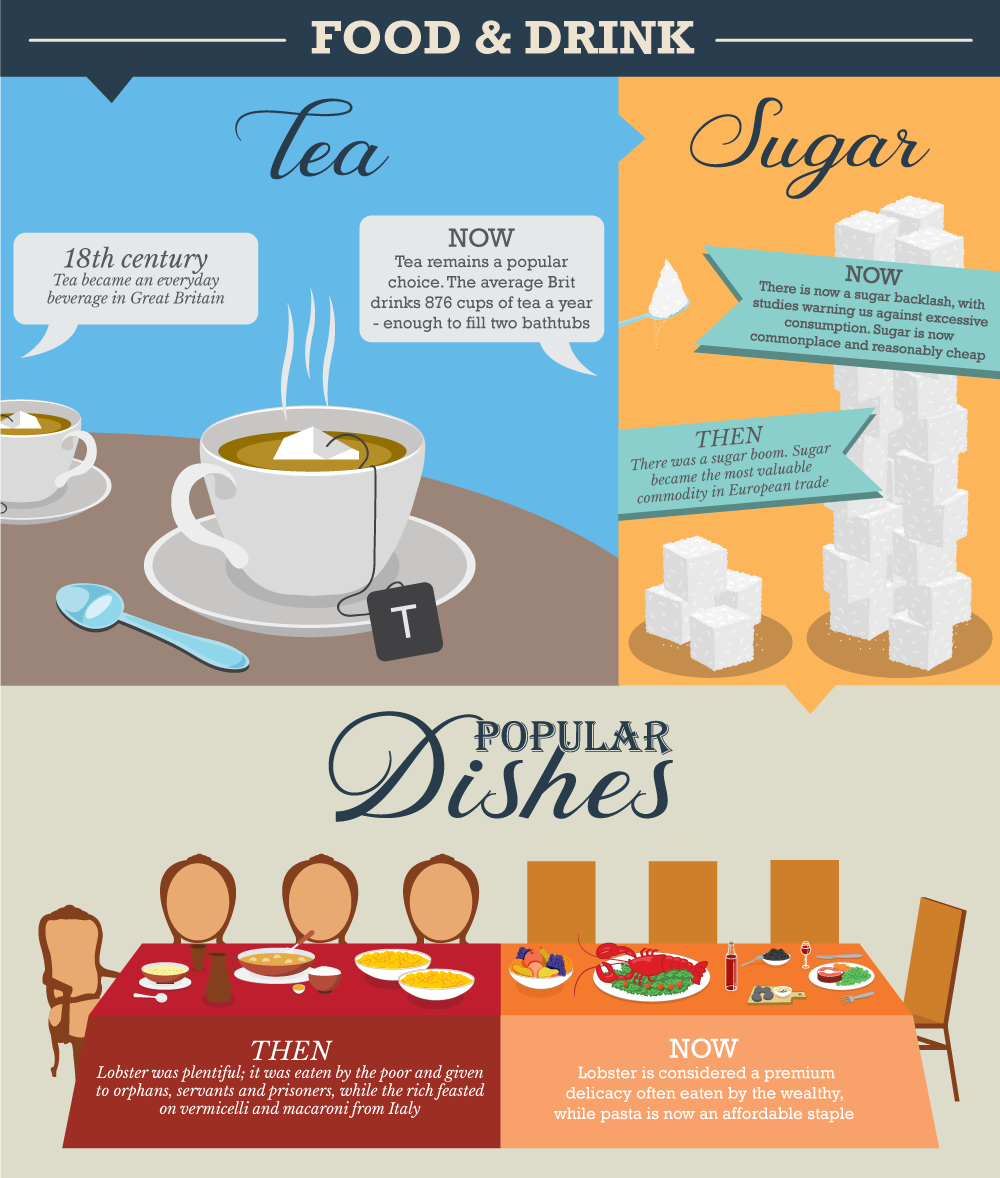
Along with creating the main infographic, the client wanted us to design a mobile version that wouldn’t be too stressful on the viewer's eye. We decided to restructure each individual graphic into a size to which one stat could fit onto a phone screen with ease. The results are what you see below


DISCLAIMER: I do not claim to own the works detailed in this page. Ownership belongs to that of the client under the creation of M2 Bespoke.